Unit 5
Cleaning and charting data
Hunt down missing and wrong values before they spoil your answers, then draw charts that tell the truth.
Read
When the data lies
Class 6B measured their heights for a science project. Seven pupils' results went into a list, and the project group asked the computer for the average height.
The computer answered: 354 cm.
That is taller than a giraffe's neck. Nobody is 354 cm tall. The program did its sums perfectly. The data was the problem. Look at the list:
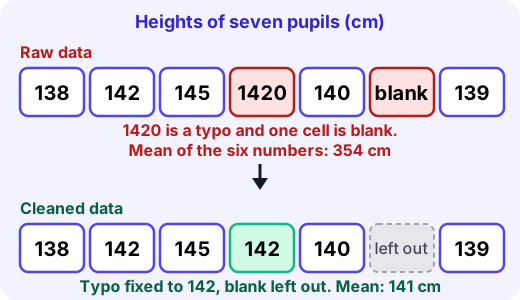
One pupil's height was typed as
1420instead of142. Another pupil was absent and left a blank. The computer cannot know these are mistakes. It just adds what it is given and reports a confident, wrong answer. That is the big idea of this unit:Messy data gives wrong answers confidently. Cleaning comes before calculating.
The usual suspects
Problem What it looks like Example Missing value a blank, None,N/A, or a made-up code like-999an absent pupil, a broken sensor Wrong value impossible or typo height 1420, age-11, month13Outlier very different from the rest, maybe real, maybe not a 190 cm pupil in a class where others are 135 to 150 cm Duplicate the same record twice one pupil entered two times Inconsistent spelling same thing written differently 6B,6 b,Class 6BStep 1: look before you calculate
Print the data, sort it, and check the smallest and biggest values. A wrong value almost always shows up as an extreme. Ask: is this possible? A person cannot be 1420 cm tall, so that value is an error. Ask: is this just unusual? A pupil of 175 cm in a class of 11-year-olds is rare but real, so that value is an outlier to keep.
Step 2: decide what to do, then write it down
For each problem you have three choices.
- Fix it, but only if you can be sure.
1420is almost certainly142with a stray zero, and you can check by asking the pupil or looking at the original sheet. - Leave it out. Drop the record from the calculation and say how many you left out.
- Keep it. Real outliers stay, because they are part of the truth. You may report the result with and without them.
Be careful about filling in a missing value. Replacing a blank with
0is a classic trap: a height of 0 cm drags the mean down and looks like real data. Leaving the blank out is usually more honest. (Statisticians sometimes fill a gap with a sensible estimate, but they always say they did.)Example. The heights are
138, 142, 145, 1420, 140, (blank), 139.- Raw: the six numbers add up to 2124, and cm. Wrong.
- Fix
1420to142after checking the sheet, and leave the blank out. The six numbers are 138, 142, 145, 142, 140, 139, adding to 846, and cm. Sensible.
A single typo moved the mean by more than 200 cm. The mean is very sensitive to extreme values; this is exactly why you look first.
Try it: Find a list of numbers around you, such as marks in a notebook. Check: is there anything impossible, any gap, any repeat? Write each problem and say whether you would fix, drop or keep it.
Keep a cleaning log
Never silently change data. Write down: what you found, what you did, and how many records it affected. "Removed 1 blank row; corrected 1420 to 142 using the paper sheet." A reader can then trust your result, or disagree with a choice you made.
Charting honestly
Once the data is clean, you often draw it. A chart is a claim, and it can be honest or misleading even when every number is right.
Here are two bar charts of the same shop sales, 50 for A and 52 for B.
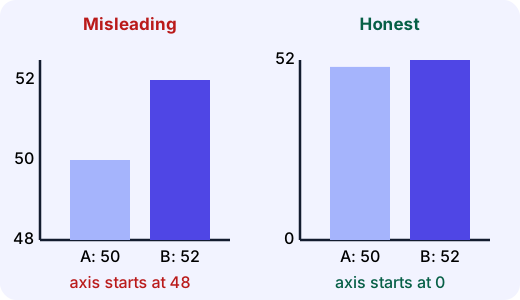
On the left the axis starts at 48, so the bars are 2 and 4 units tall. B looks twice as big as A. In truth B is only times A, 4% more. The chart on the right starts at 0 and shows the real size of the gap.
A short checklist for honest charts:
- Bars start at zero. Bar length stands for the amount, so cutting the bottom off the bar lies about the ratio. (A line chart of change over time may use a closer range, but label it clearly.)
- Label the axes and units, and give the chart a title that says what it shows.
- Use equal steps on an axis, and choose a chart that fits: bars to compare groups, lines for change over time.
- Show your cleaned data and say what you removed, for example "n = 6 pupils; 1 absent".
- Do not stretch or squash the shape to make a change look dramatic.
Common mistakes
- "Delete any outlier." Not if it is real. Check it first, then decide.
- "Replace blanks with 0." A zero is a value; a blank is no value.
- "The computer calculated it, so it must be right." The computer is only as right as its data.
- "A chart with an exciting shape is a good chart." A good chart shows what is there, not what you wish were there.
Why it matters
Real data is almost never clean. People mistype, sensors fail, forms are left blank. Data detectives spend a large part of their time on cleaning, and they trust a number only after asking where it came from.
- Fix it, but only if you can be sure.
Lab
The clean-up desk
A class height list has been typed in with mistakes. For each row decide whether to keep it, fix it or leave it out, and watch the mean and the chart change. Then make sure the chart is honest.
Your goals
- Find and handle the typo, the blank, the impossible zero and the duplicate row.
- Keep the tall pupil, whose height is unusual but real.
- Set the chart's axis to start at zero, then check your cleaning.
The interactive lab opens once you register. Register to do this.
Quick check
Cleaning and charting check
Eight questions. Think about what the numbers really mean, not only what they add up to.
1.Heights in cm are [150, 152, 148, 1500, 150]. What is the mean of all five numbers?
Answer with a number
2.The 1500 was a typo for 150. What is the mean after fixing it?
Answer with a number
3.2 of the 30 marks in a class list are blank because the pupils were absent. What is the best way to find the class mean?
- Replace the blanks with 0 and use all 30
- Leave the blanks out, use the 28 marks, and say so
- Replace the blanks with 100 to be kind
- Do not calculate a mean at all
Choose one
4.Ages in a Class 6 list are 11, 12, 11, 111, 10, -11, 12, 13. Which values are almost certainly errors?
- 111
- 13
- -11
- 10
Choose all that apply
5.In a class where most pupils are 135 to 150 cm, one is recorded as 190 cm. What should you do first?
- Delete it, because it is an outlier
- Check whether it is real, for example by re-measuring
- Divide it by 2 so it fits in
- Ignore it and say nothing
Choose one
6.A bar chart shows two schools' pass rates, 96% and 98%, but its axis starts at 95%. What is wrong with it?
- The axis cut makes the 98% bar look about three times as tall as the 96% bar
- The bars should be the same colour
- Nothing: the numbers are labelled
- It should be a pie chart
Choose one
7.A bar chart's axis starts at 48. Bar A is 2 units tall and bar B is 4 units tall on the page. How many times taller does B look than A?
Answer with a number
8.Match each data problem to the sensible fix.
- A blank mark for an absent pupil
- 1420 cm where all others are near 140
- The same pupil entered twice
- 6B, 6 b and Class 6B in one column
Match each to: Remove the duplicate row · Standardise to one spelling · Check the original sheet, then correct the typo · Leave it out and note how many
Answering and checking are for registered learners. Register to do this.
Quick check
New puzzles with messy data
Clean first, calculate second. Each puzzle hides a problem in the data or in the chart.
1.Pulse readings (beats per minute) after exercise are [96, 102, 99, 0, 105, 98]. The 0 is a sensor failure, not a real pulse. What is the mean of the real readings?
Answer with a number
2.A news chart says 'Crime has doubled!' It compares 20 incidents last year with 21 this year, but its axis starts at 19. By what percentage did incidents truly rise?
Answer with a number
3.A weather log of temperatures in °C is [31, 33, 32, -999, 34], where -999 is a code for 'sensor off'. What is the mean of the valid readings?
Answer with a number
4.A shop's daily sales are mostly about ₹5,000, but one day shows ₹50,000. The owner confirms a big wedding order really happened. What is the best way to report the average daily sales?
- Delete that day, because it is far from the others
- Keep it, and also report the average without it so readers can see the difference
- Change it to 0
- Say nothing about it
Choose one
5.Put the steps of a careful data clean-up in order.
- Decide for each problem: fix, leave out or keep
- Make the changes and write them in a cleaning log
- Calculate and chart the cleaned data
- Look at the data and list the problems
Put these in order
Answering and checking are for registered learners. Register to do this.
Your turn
The sleep survey
Eight pupils reported how many hours they slept last night:
8, 9, 7.5, 8, 90, 8.5, (blank), 7- List each problem you can see in the data. For each, say whether you would fix it, leave it out or keep it, and why.
- Work out the mean number of hours after your cleaning. Show the numbers you added and how many you divided by. Say what the mean would have been if you had averaged the raw numbers and treated the blank as 0, and what that tells you.
- You will draw a bar chart comparing the average sleep of Class 6A (8.0 hours) and Class 6B (7.5 hours). Describe two choices you would make so the chart is honest, and one choice that would make it misleading.
How it's judged
- Finding and handling problems
- Calculating after cleaning
- Honest charting
Writing and submitting your answer is for registered learners. Register to do this.
Like what you see?
Register for free to answer the quick checks, do the activities and save your work. Your work is saved on your device and syncs to your account.