Unit 16
Data distributions
Ask questions that have varied answers, then describe the centre, spread and shape of the data with means, medians, IQR, dot plots, histograms and box plots.
Read
Centre, spread and shape
How long does it take you to get to school? Say "15 minutes" and you have answered for one morning. But ask your whole class and you get many different answers: 5, 10, 25, even 60 for the one who lives across the river. A single question now produces a whole distribution of numbers. To understand it we ask three things: where is its centre, how widely is it spread, and what is its shape?
Statistical questions
A statistical question is one where you expect the answers to vary, and you answer it by collecting data.
Question Statistical? How many students are in my class? No: one answer. How long does each student in my class take to reach school? Yes: answers vary. What is the height of Meera? No: one answer. How tall are the Class 6 students in my school? Yes. Our data set
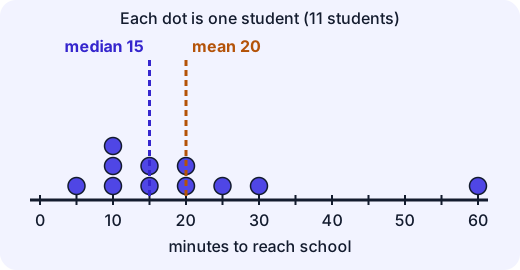
Eleven students report their travel time to school, in minutes:
A dot plot puts one dot above the number line for each value.
Centre: mean and median
The mean is the "fair share" value: share the total equally. The total is minutes among 11 students:
The mean is also the balance point of the dots: if the number line were a seesaw, it would balance there.
The median is the middle value when the data are in order. With 11 values it is the 6th: 15. With an even number of values, take the mean of the two middle ones. Example: for the middle two are 9 and 10, so the median is .
Why are they different here? The student who travels 60 minutes pulls the mean up. Remove that value and the mean drops to , while the median stays at 15. The median is resistant to extreme values; the mean is not.
Misconception. "The mean is always the best 'typical' value." Not if there are extreme values. Five friends with pocket money ₹40, ₹45, ₹50, ₹50 and ₹515 have a mean of ₹140, which describes nobody. The median, ₹50, describes the group.
Spread: range and IQR
The range is the largest value minus the smallest: . It uses only two values and is thrown off by any extreme.
To avoid that, split the ordered data into four equal parts with quartiles. The median is the middle (the second quartile). The first quartile is the median of the lower half, and the third quartile is the median of the upper half. (With an odd number of values, leave out the median itself when you split.)
Lower half: gives . Upper half: gives .
the interquartile range: how wide the middle half of the data is. The IQR ignores the extremes, so the 60 does not affect it.
Example. Data: . Median . Lower half gives ; upper half gives . , range .
Box plots
A box plot draws the five-number summary: minimum, , median, , maximum.
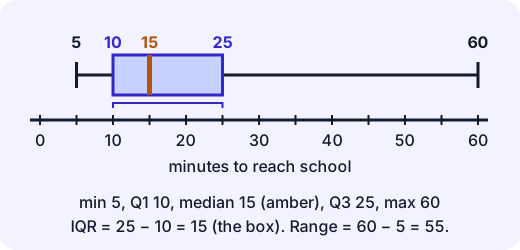
The box runs from to with a line at the median, and whiskers reach the minimum and maximum. Each quarter of the data lies in one of the four sections: the box holds the middle half. A long whisker, like the one to 60, signals an unusual value.
Histograms and shape
A histogram groups data into equal-width bins and draws a bar for how many values fall in each. It is useful when there are many values. (A value on the edge goes in the bin that starts there: 10 goes in the 10-to-20 bin.)
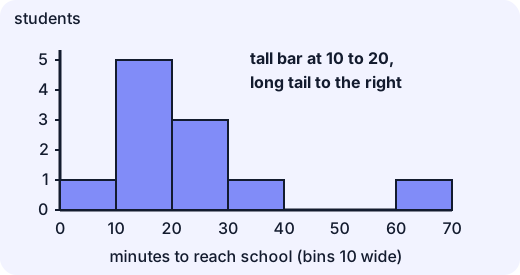
The shape tells a story:
- Symmetric: the left and right halves mirror each other; mean and median are close.
- Skewed right: a long tail to the right (as here); the mean is pulled above the median.
- Skewed left: a long tail to the left; mean pulled below the median.
- Outlier: a value far from the rest, like 60 here.
Choosing summaries
Situation Centre Spread Roughly symmetric, no outliers mean range, or IQR Skewed or has outliers median IQR A full description has all three parts. For our travel times: the median is 15 minutes, the middle half of students take between 10 and 25 minutes (IQR 15), and the shape is skewed right, with one student at 60.
Example (working backwards). The mean of five numbers is 8. Four of them are . The total must be . The four add to 32, so the fifth is 8.
Summary
- A statistical question has varied answers and is answered with data.
- Centre: mean (fair share, balance point) and median (middle value).
- Spread: range and IQR ().
- Dot plots, histograms and box plots show a distribution; its shape can be symmetric or skewed, with or without outliers.
- Outliers move the mean and the range a lot, and the median and IQR very little.
Lab
The dot plot builder
Build data sets by adding dots to a number line from 0 to 10. The lab shows the mean, median, range, quartiles and a box plot as you go. Then complete four challenges that ask for a data set with a particular centre, spread or shape.
Your goals
- Watch how adding a far-away dot changes the mean, median, range and IQR.
- Build data sets for all four challenges.
The interactive lab opens once you register. Register to do this.
Quick check
Data distributions check
Eight questions on statistical questions, centre, spread and plots. For quartiles, leave out the median when the number of values is odd.
1.Which of these is a statistical question?
- How many students are in my class?
- How many hours does each Class 6 student in my school sleep on a school night?
- How many hours did Arun sleep last night?
- Is 7 an odd number?
Choose one
2.Find the mean of 4, 7, 6, 3, 10.
Answer with a number
3.Find the median of 12, 7, 9, 15, 6, 10.
Answer with a number
4.Find the range of 23, 8, 15, 31, 12.
Answer with a number
5.Find the IQR of 2, 4, 5, 7, 8, 9, 12.
Answer with a number
6.Five friends have pocket money of ₹40, ₹45, ₹50, ₹50 and ₹515. Which gives the best idea of what a typical friend has?
- The median, ₹50
- The mean, ₹140
- The range, ₹475
- None of these is useful
Choose one
7.The mean of five numbers is 8. Four of them are 6, 9, 7 and 10. What is the fifth number?
Answer with a number
8.In a box plot, about what fraction of the values lies inside the box (from Q1 to Q3)?
- One quarter
- One half
- Three quarters
- All of them
Choose one
Answering and checking are for registered learners. Register to do this.
Quick check
New puzzles with data
Use centre, spread and plots in situations that are new.
1.Five test scores are 50, 60, 70, 80 and 90. A sixth student scores 100. What is the mean of all six scores?
Answer with a number
2.Two cricketers have a median score of 30 in their last 20 matches. Asha's IQR is 4. Bimal's IQR is 22. Whose scores are more consistent?
- Asha's, because her middle half of scores is packed in a narrower range
- Bimal's, because a larger IQR is better
- They are equally consistent because the medians are equal
Choose one
3.A box plot shows: minimum 3, Q1 8, median 12, Q3 20, maximum 31. What is the IQR?
Answer with a number
4.In that same box plot, about what fraction of the values are greater than 20?
- One quarter
- One half
- Three quarters
- It cannot be told
Choose one
Answering and checking are for registered learners. Register to do this.
Your turn
Compare two data sets
Priya and Dev each recorded their daily steps (in thousands) for 7 days.
- Priya: 6, 7, 8, 8, 8, 9, 10
- Dev: 2, 4, 6, 8, 10, 12, 14
- Find the mean, median, range and IQR for each person. (For quartiles, leave out the median when you split the data.)
- Describe each person's data in a sentence or two: centre, spread and shape.
- Someone says "Priya and Dev walk the same amount because their means are equal." Explain what that claim misses, using your numbers.
How it's judged
- Calculations
- Describing distributions
- Interpreting
Writing and submitting your answer is for registered learners. Register to do this.
Like what you see?
Register for free to answer the quick checks, do the activities and save your work. Your work is saved on your device and syncs to your account.