Unit 14
Bar graphs
Draw a bar graph from a tally and read it to find the most, the least and how many more.
Read
A bar's length shows how many
Class 2B voted for their favourite fruit. The teacher made tally marks on the board: mango 7, guava 3, banana 4, apple 5. Now she wants a picture that shows the winner at a glance. She draws a bar graph.
A bar graph shows how many with bars. The longer the bar, the more there are. That is the big idea.
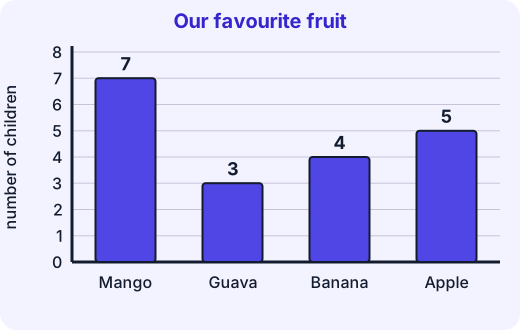
The parts of a bar graph
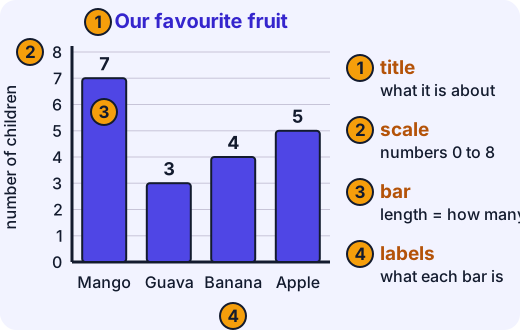
- The title says what the graph is about.
- The scale is the numbers up the side. It starts at 0. On our graph, every line goes up by 1.
- A bar is as long as the number it shows.
- The labels under the bars say what each bar is.
How to draw one
- Write the title: "Our favourite fruit".
- Draw the scale. Start with 0 at the bottom and number each line 1, 2, 3 ... up to a number that is at least as big as your biggest count. Here the biggest count is 7, so we go up to 8.
- Write the names of the fruits along the bottom, with the same space between them.
- Draw each bar from the 0 line up to its number. Make all the bars the same width.
- Check each bar against the tally.
Example. Guava has 3 tally marks. Its bar starts at 0 and reaches the line numbered 3.
Try it: Draw a bar graph of the first letters of the names of five people in your family. Does any letter have a taller bar?
Reading a bar graph
Look at the top of the bar and read the number on the scale. Do not count the bars or the lines you cross; read the number the top is level with.
How many more? To compare two bars, find the difference.
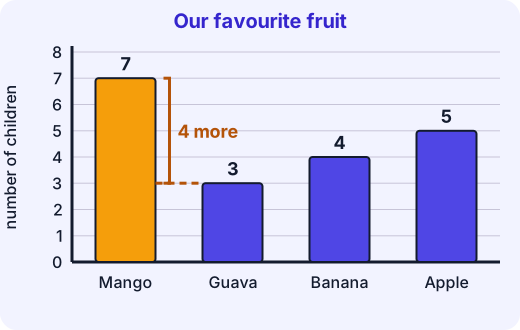
Example. Mango is 7 and guava is 3. How many more children chose mango? . 4 more chose mango.
How many in all? Add the numbers from all the bars: children voted.
Most and least. The tallest bar is the most popular and the shortest bar is the least popular. Mango is the most; guava is the least.
Mistakes to watch for
- A scale that does not start at 0. Bars must start from the 0 line.
- Bars of different widths, which make a graph harder to read.
- Forgetting the title or the labels. Nobody then knows what the bars are about.
- Reading the number from the wrong line. Put a finger on the top of the bar and slide it across to the scale.
For the grown-up helping
Collect real data with your child, such as the favourite colours of the family or the number of different vehicles seen from a window. Make a tally first, then draw the graph on squared paper with one square for each count. Ask questions such as "Which is the most? How many more is that than the least? How many in all?" If your child counts bars instead of reading the scale, put a ruler across the top of the bar and read the number.
Lab
The graph maker
Build bar graphs from counts by tapping squares above the bars, then read graphs to say how many more, how many in all and which is the least.
Your goals
- Build two bar graphs so that every bar matches its count.
- Answer how-many-more and how-many-in-all questions by reading the bars.
- Find the shortest bar on a graph.
The interactive lab opens once you register. Register to do this.
Activity
Ask, count and graph
Your child asks a question, collects answers, and draws a bar graph on squared paper. About 30 minutes.
You'll need
- Squared paper (or paper and a ruler to draw squares)
- A pencil and coloured pencils
- A ruler
Steps
- Choose a question with 3 or 4 possible answers, such as "Which fruit do you like best: mango, banana, apple or orange?" Your child writes the question and the choices on paper.
- Ask 10 to 15 people at home or family and friends. Your child makes a tally mark for each answer. Ask each person only once.
- Count each tally. Write the totals. Check that the totals add up to the number of people asked.
- Your child draws the graph. Write a title. Draw the scale up the side, starting at 0, with one square for each person. Write the answers along the bottom. Draw bars of the same width from the 0 line up.
- Ask three questions about the graph. "Which is the most popular? How many more people chose that than the least popular? How many people did you ask in all?"
- Ask "How can you check that a bar is the right length?" Your child checks one bar against the tally.
Safety
- Your child should only ask people they know, with a grown-up nearby, and never go to strangers.
- Use a blunt pencil and keep the ruler flat on the table.
Keeping a log of the activity is for registered learners. Register to do this.
Quick check
Bar graphs check
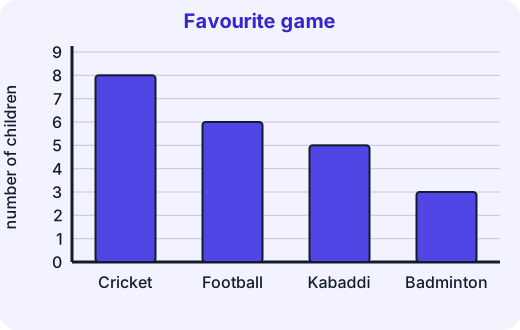
Seven questions about bar graphs. On this graph every line goes up by 1.
1.How many children chose football?
Answer with a number
2.How many more children chose cricket than badminton?
Answer with a number
3.Which game is the most popular?
- Cricket
- Football
- Kabaddi
- Badminton
Choose one
4.How many children voted in all? Each child chose one game.
Answer with a number
5.What does the length of a bar show?
- How many there are of that thing
- What the thing is called
- How big the thing is
Choose one
6.Put the games in order, from the fewest children to the most children.
- Badminton
- Football
- Kabaddi
- Cricket
Put these in order
7.Which of these does a good bar graph have?
- A title
- Labels that say what each bar is
- Numbers up the side, starting at 0
- A picture of every child
Choose all that apply
Answering and checking are for registered learners. Register to do this.
Quick check
New puzzles
Bar graphs help us think about all kinds of counts. Use what you know.
1.Ravi counted the books that four friends read. They read 4, 9, 6 and 2 books. He draws a scale that starts at 0. What is the smallest number the scale must reach so that every bar fits?
Answer with a number
2.15 children each chose rice or roti. The rice bar reaches the line numbered 8. How tall is the roti bar?
Answer with a number
3.On a graph, the cat bar reaches 6 and the dog bar reaches 3. Hina says, "The cat bar is twice as tall as the dog bar, so there are 2 more cats." Is she right about "2 more"?
- No. 6 - 3 = 3, so there are 3 more cats
- Yes. There are 2 more cats
- No. 6 + 3 = 9, so there are 9 more cats
Choose one
4.Which question can a bar graph of the class's favourite fruits answer?
- Which fruit do most children in the class like?
- Why do the children like mangoes?
- Which fruit will they like next year?
Choose one
Answering and checking are for registered learners. Register to do this.
Activity
Tell it back
Your child explains what a bar graph shows and how to read it. About five minutes.
Steps
- Show a bar graph, such as the one your child drew, or one from a newspaper or book. Ask "What does the length of a bar tell us?"
- Ask "How do you find how many more one bar is than another?" and "Why must the scale start at 0?" Write down what your child says in their own words.
Keeping a log of the activity is for registered learners. Register to do this.
Like what you see?
Register for free to answer the quick checks, do the activities and save your work. Your work is saved on your device and syncs to your account.